pdfkit Python で作成するPDFのサイズ

データーベースなどから読み込んだデータをPDF帳票出力する時に、表組出力~罫線等で囲んで
連続した出力をする場合、

Jasperreports on Java 詳細で複雑な表でも可能だが、
XMLテンプレート作成がとても面倒で労力が必要
ReportLab on Python テンプレート作成ではなくフラグメント作成→連続出力だが、
機能を習得するのがとてもたいへんで学習コストがかかる

そんな壁があるなら、一度HTMLで、ul-li タグや、table タグで出力して、
HTMLからPDFに変換すれば良い。
なにも学習コストで時間を費やす必要がなく効率的と考える。

PDF出力で必要なレイアウト決定の為に、
A4サイズ、マージン=0.4 inch で、1ページの縦横サイズを、
以下、Python と HTMLで求めた。
pdfkit · PyPI が必要なので、インストールしておき、

 pdfkit.from_file( HTMLファイルPATH , 出力PDFファイルPATH , options=options)

で、HTML→PDF作成である。

A4 向き Portrait HTML→PDF
'orientation': 'Portrait' を指定する。default は、Portrait でよく省略されてる。

import pdfkit

options = {
    'page-size': 'A4',
    'orientation': 'Portrait',
    'margin-top': '0.4in',
    'margin-right': '0.4in',
    'margin-bottom': '0.4in',
    'margin-left': '0.4in',
    'encoding': "UTF-8",
    'no-outline': None
}
pdfkit.from_file("portrait.html", "out_port.pdf", options=options)

A4 向き Portrait サイズ確認用 HTML

<!DOCTYPE html>
<html>
<head>
<meta charset="UTF-8">
<meta http-equiv="content-language" content="ja">
<meta name="viewport" content="width=device-width, initial-scale=1">
<title>portrait</title>
<style type="text/css">
html{ width:100%; height:100%; }
body{
	margin: 0;
	padding: 0;
}
#content{
    border: 1px solid #000099;
    width: 1432px;
    height: 2074px;
}
</style>
</head>
<body>
<div id="content"></div>
</body>
</html>

A4 横向き Landscape HTML→PDF
 'orientation': 'Landscape' を指定する。

import pdfkit

options = {
    'page-size': 'A4',
    'orientation': 'Landscape',
    'margin-top': '0.4in',
    'margin-right': '0.4in',
    'margin-bottom': '0.4in',
    'margin-left': '0.4in',
    'encoding': "UTF-8",
    'no-outline': None
}
pdfkit.from_file("landscape.html", "out_landscape.pdf", options=options)

A4 横向き Landscape サイズ確認用 HTML

<!DOCTYPE html>
<html>
<head>
<meta charset="UTF-8">
<meta http-equiv="content-language" content="ja">
<meta name="viewport" content="width=device-width, initial-scale=1">
<title>landscape</title>
<style type="text/css">
html{ width:100%; height:100%; }
body{
    margin: 0;
	padding: 0;
}
#content{
    border: 1px solid #000099;
    width: 2092px;
    height: 1432px;
}
</style>
</head>
<body>
<div id="content">
</div>
</body>
</html>

まとめると、
PDF変換元HTMLは、
A4サイズ PDF(左右上下マージン=0.4inch)
を作成するために、

A4 width height
Portrait(縦向き) 1432px 2074px
Landscape(横向き) 2092px 1432px

で、HTMLの CSSレイアウトを組む必要がある。

Google gson MalformedJsonException のパターン

Google gsonJSON読込みした時に発生する MalformedJsonException
のパターンとは、以下の表にまとめることができる。
エラーのパターンは、これ以外あるかもしれないが、だいたいこんなところ。

例外のメッセージ エラーの意味 JSONエラーの例
Unterminated object value表現エラー "date" : 2019/12/03
Unterminated String value表現エラー
(文字列が期待されてるのに文字列認識できない)
"a": '
Unterminated array value表現エラー
(配列が期待されてるのに、配列認識できない)
"a" : ["A":12]
Expected name キーの表現が解釈できない(想定できない) {} : 2
: 2
Expected ':' key-value 区切り文字が ':' でない 'a';1
"a"\t 2
Expected value value 表現解釈できない(想定できない) "data": /03
Unexpected value 想定外の value "a":

日付を value として表現する クォートもダブルクォートでも括らない

 "date" : 2019-12-03

は、エラーにならないが、

 "date" : 2019/12/03

は、Unterminated object になる。
Unexpected value や、Expected value 等は、沢山ケースがありそうだ。
これら、MalformedJsonException 発生として捕捉できるエラーであるが、
では、先日作成した
oboe2uran.hatenablog.com

この中の エラー捕捉処理として上の表のエラー詳細の種類まで、
認識してラムダで処理できるように、
先日作ったものを改良すべきか悩んでいる。。
(改良することは簡単なのだが、ラムダ式の引数が増えるので、仕様として躊躇している。)

2019-4-6 結局、ラムダ式の引数を追加した。。。

malformedcatch · yipuran/yipuran-gsonhelper Wiki · GitHub

https://github.com/yipuran/yipuran-gsonhelper/blob/master/src/main/java/org/yipuran/gsonhelper/JsonErrorConsumer.java

Chart.js Time グラフの為のデータJSONを作成するクラス

Chart.js https://www.chartjs.org/ X軸=時刻 の線グラフを描画するためのJSONデータ作成する
Java クラスを作成して、AJAX通信によるJSONデータ → Chart.js グラフ描画をデザインを除いた
可変の JSONデータ生成だけでも汎用的にならないかと考えました。

グラフ描画の点となるデータの定義の Javaオブジェクト
整数(int) と 小数点 (double) 各々のケースを考慮して用意します。

import java.io.Serializable;
import java.time.LocalDateTime;
/**
 * LocalDateTime - 整数値 
 */
public class IntPoint implements Serializable{
   /** グラフX軸の時刻. */
   public LocalDateTime time;
   /** グラフY軸の値. */
   public Integer value;
   public IntPoint(){}
   public IntPoint(LocalDateTime time, int value){
      this.time = time;
      this.value = value;
   }
   public void setTime(LocalDateTime time){
      this.time = time;
   }
   public void setValue(int value){
      this.value = value;
   }
   @Override
   public String toString() {
      return "Pointer(" + time + ", " + value + ")";
   }
}
import java.io.Serializable;
import java.time.LocalDateTime;
/**
 * LocalDateTime - 小数点
 */
public class DoublePoint implements Serializable{
   /** グラフX軸の時刻. */
   public LocalDateTime time;
   /** グラフY軸の値. */
   public Double value;
   public DoublePoint(){}
   public DoublePoint(LocalDateTime time, double value){
      this.time = time;
      this.value = value;
   }
   public void setTime(LocalDateTime time) {
      this.time = time;
   }
   public void setValue(Double value) {
      this.value = value;
   }
}

JSON生成するクラス、Google gson を使います。

import java.time.LocalDateTime;
import java.util.ArrayList;
import java.util.HashMap;
import java.util.List;
import java.util.Map;
import org.yipuran.gsonhelper.LocalDateTimeAdapter;
import com.google.gson.Gson;
import com.google.gson.GsonBuilder;
/**
 * Time Chart Json Builder.
 * <PRE>
 *
 * String json = new TimeChartJsonBuilder()
 *              .addIntegers(list)
 *              .addYAxesMin(10)
 *              .addYAxesMax(500)
 *              .addStepSize(20)
 *              .addFontSize(12)
 *              .build();
 *
 * String json = new TimeChartJsonBuilder()
 *              .addDoubles(list)
 *              .addMaxTicksLimit(5)
 *              .build();
 * </PRE>
 */
public final class TimeChartJsonBuilder{
   private Gson gson;
   private Map<String, Object> map;
   private int min = 0;
   private int max = 100;
   private Integer yAxesMax = null;
   private int yAxesStepSize = 10;
   private Double doubleStepsize = null;
   private int fontSize = 12;
   private Integer maxTicksLimit = null;
   private LocalDateTime xAxesMin = null;
   private LocalDateTime xAxesMax = null;
   private List<Map<String, Object>> mlist = new ArrayList<>();

   public TimeChartJsonBuilder(){
      map = new HashMap<>();
      gson = new GsonBuilder().registerTypeHierarchyAdapter(LocalDateTime.class, LocalDateTimeAdapter.of("yyyy/MM/dd HH:mm:ss.SSS")).create();
   }
   public TimeChartJsonBuilder addIntegers(List<IntPoint> list){
      if (list.size() > 0){
         max = list.stream().max((a, b)->a.value.compareTo(b.value)).map(e->e.value.intValue()).orElse(100);
         LocalDateTime tmin = list.stream().map(e->e.time).min((a, b)->a.compareTo(b)).orElse(null);
         if (tmin != null){
            xAxesMin = xAxesMin==null ? tmin : xAxesMin.compareTo(tmin) < 0 ? xAxesMin : tmin;
         }
         LocalDateTime tmax = list.stream().map(e->e.time).max((a, b)->a.compareTo(b)).orElse(null);
         if (tmax != null){
            xAxesMax = xAxesMax==null ? tmax : xAxesMax.compareTo(tmax) < 0 ? tmax : xAxesMax;
         }
         Map<String, Object> map = new HashMap<>();
         map.put("plist", list);
         mlist.add(map);
      }
      return this;
   }
   public TimeChartJsonBuilder addDoubles(List<DoublePoint> list){
      if (list.size() > 0){
         max = list.stream().max((a, b)->a.value.compareTo(b.value)).map(e->e.value.intValue()).orElse(100);
         LocalDateTime tmin = list.stream().map(e->e.time).min((a, b)->a.compareTo(b)).orElse(null);
         if (tmin != null){
            xAxesMin = xAxesMin==null ? tmin : xAxesMin.compareTo(tmin) < 0 ? xAxesMin : tmin;
         }
         LocalDateTime tmax = list.stream().map(e->e.time).max((a, b)->a.compareTo(b)).orElse(null);
         if (tmax != null){
            xAxesMax = xAxesMax==null ? tmax : xAxesMax.compareTo(tmax) < 0 ? tmax : xAxesMax;
         }
         Map<String, Object> map = new HashMap<>();
         map.put("plist", list);
         mlist.add(map);
      }
      return this;
   }

   public TimeChartJsonBuilder addYAxesMin(int min){
      this.min = min;
      return this;
   }
   public TimeChartJsonBuilder addYAxesMax(int yAxesMax){
      this.yAxesMax = yAxesMax;
      return this;
   }

   public TimeChartJsonBuilder addFontSize(int fontSize){
      this.fontSize = fontSize;
      return this;
   }
   public TimeChartJsonBuilder addStepSize(int yAxesStepSize){
      this.yAxesStepSize = yAxesStepSize;
      return this;
   }
   public TimeChartJsonBuilder addStepSize(double yAxesStepSize){
      this.doubleStepsize = yAxesStepSize;
      return this;
   }
   public TimeChartJsonBuilder addMaxTicksLimit(int maxTicksLimit){
      if (maxTicksLimit < 1) throw new IllegalArgumentException("maxTicksLimit must be over 1");
      this.maxTicksLimit = maxTicksLimit;
      return this;
   }
   public TimeChartJsonBuilder addXAxesMin(LocalDateTime xAxesMin){
      this.xAxesMin = xAxesMin;
      return this;
   }
   public TimeChartJsonBuilder addXAxesMax(LocalDateTime xAxesMax){
      this.xAxesMax = xAxesMax;
      return this;
   }

   public String build(){
      map.put("list", mlist);
      map.put("yAxesMin", min);
      map.put("yAxesStepSize", yAxesStepSize <= 0 ? max : yAxesStepSize);
      max = (max / yAxesStepSize + 1) * yAxesStepSize;
      map.put("yAxesMax", yAxesMax==null ? max : yAxesMax);
      if (doubleStepsize != null) map.put("yAxesStepSize", doubleStepsize);
      if (maxTicksLimit != null) map.put("maxTicksLimit", maxTicksLimit);
      map.put("yAxesFontSize", fontSize);
      map.put("xAxesMin", xAxesMin);
      map.put("xAxesMax", xAxesMax);
      return gson.toJson(map);
   }
}

Wicket Pageでの使用

List<IntPoint> list ;
// list に描画するデータを格納
TimeChartJsonBuilder builder = new TimeChartJsonBuilder().addIntegers(list)
.addYAxesMax(200)
.addStepSize(20);
String json = builder.build();
try(StringResourceStream s = new StringResourceStream(json)){
    getRequestCycle().scheduleRequestHandlerAfterCurrent(
         new ResourceStreamRequestHandler(s)
    );
}catch(IOException e){
    logger.warn(e.getMessage(), e);
}

注意しなければならないのは、TimeChartJsonBuilder の addIntegers で渡すリストは
グラフ描画の為の時系列に並んでなければならない。必要であればメソッドの実行前にソート
する必要がある。

HTML Chart.js と moment-with-locale.js を使用できるように ヘッダは記述しておく。
https://momentjs.com/

<div class="chart">
   <canvas id="myChart"></canvas>
</div>

JSソース

var graph = {
   xLabels: [],
   yLabels: [],
   datasets: [{
      label: "Value",
      lineTension: 0,
      backgroundColor: "rgba(185, 64, 71, 0.6)",
      borderColor: "rgba(185, 64, 71, 0.6)",
      borderWidth: 1,
      borderCapStyle: 'round',
      borderDash: [],
      borderDashOffset: 0.0,
      borderJoinStyle: "round",
      pointBorderColor: "rgba(185, 64, 71, 0.6)",
      pointBackgroundColor: "rgba(185, 64, 71, 0.6)",
      pointBorderWidth: 0,
      pointHoverRadius: 4,
      pointHoverBackgroundColor: "rgba(185, 64, 71, 0.6)",
      pointHoverBorderColor: "rgba(185, 64, 71, 0.6)",
      pointHoverBorderWidth: 4,
      pointRadius: 0,
      pointHitRadius: 10,
      fill: false,
      spanGaps: false,
      data: [],
      yAxisID: "y-axis-1",
   }]
};
var options = {
   responsive: true,
   title:{ display:true,
      text:'Sample'
   },
   scales: {
      xAxes: [{ display: true,
         scaleLabel: { display: true, labelString: 'Time' },
         type: "time",
         time: {
            displayFormat: true,
            displayFormats: { minute: "HH:mm" },
            stepSize: 2
         },
      }],
      yAxes: [{ display: true,
         id: "y-axis-1",
         offset: true,
         scaleLabel: { display: true, labelString: 'Value',  fontSize: 22 },
         ticks: {}
      }]
   },
   chartArea: {
      /* グラフ領域の背景色 */
      backgroundColor: 'rgba(240, 248, 255, 1)'
   },
   tooltips: {
      callbacks: {
         title: function(tooltipItem, data){
            return moment(tooltipItem[0].xLabel._d).format('YYYY年M月D日(ddd)A hh:mm:ss');
         },
         label: function(tooltipItem, data){
            return  "value:" + tooltipItem.yLabel;
         }
      }
   },
};

$(function(){
   /* moment.js 設定 */
   moment.locale('ja');
   Chart.pluginService.register({
      beforeDraw: function(c){
         if (c.config.options.chartArea && c.config.options.chartArea.backgroundColor) {
            var ctx = c.chart.ctx;
            var chartArea = c.chartArea;
            ctx.fillStyle = "rgba(255, 255, 255, 1)";           // 外側背景色の指定
            ctx.fillRect(0, 0, c.chart.width, c.chart.height);  // 外側背景色描画
            ctx.save();
            ctx.fillStyle = c.config.options.chartArea.backgroundColor;
            ctx.fillRect(chartArea.left
, chartArea.top, chartArea.right - chartArea.left, chartArea.bottom - chartArea.top);
            ctx.restore();
         }
      }
   });
   var ctx = document.getElementById("myChart").getContext("2d");
   var myChart = new Chart(ctx, {
       type: 'line',
       data: graph,
       options: options
   });

   var drawGraph = function(e){
      graph.datasets[0].data = [];
      myChart.options.scales.yAxes[0].ticks['min'] = parseInt(e.yAxesMin, 10);
      myChart.options.scales.yAxes[0].ticks['max'] = parseInt(e.yAxesMax, 10);
      myChart.options.scales.yAxes[0].ticks['stepSize'] = parseInt(e.yAxesStepSize, 10);
      myChart.options.scales.yAxes[0].ticks['fontSize'] = parseInt(e.yAxesFontSize, 10);
      if (e.xAxesMin != null){
         myChart.options.scales.xAxes[0].time['min']
          = moment(e.xAxesMin, "YYYY/MM/DD HH:mm:ss.SSS");
      }
      if (e.xAxesMax != null){
         myChart.options.scales.xAxes[0].time['max']
          = moment(e.xAxesMax, "YYYY/MM/DD HH:mm:ss.SSS");
      }
      if (e.maxTicksLimit != undefined){
         myChart.options.scales.yAxes[0].ticks['maxTicksLimit'] = e.maxTicksLimit;
      }
      $.each(e.list, function(i, data){
         $.each(data.plist, function(n, v){
            graph.datasets[i].data.push(
               { t:moment(v.time, "YYYY-MM-DD HH:mm:ss.SSS"), y:v.value }
            );
         });
      });
      myChart.update();
   };

   var init_url = "/chartsample/line"
   $.ajax({
      type: 'POST',
      timeout: 10000,
      url: init_url,
      data: { },
      dataType: 'json',
      cache: false,
   }).done(function(e){
      drawGraph(e);
   }).fail(function(e){
      // 通信エラー
   }).always(function(e){
   });
});

グラフの線、太さ、線の種類、色、背景色、スケールの文字フォントサイズ、
タイトルの文字フォントサイズ、ツールチップの表示コンテンツ、、、
沢山、JSで書かなくてはならないのだが、
1本の線だけではなく複数の線を描画するケースを考慮して、
TimeChartJsonBuilder は、複数の線のJSONデータを生成するために、
List → 複数の線、
Map → 各線のJSON 配列

private List<Map<String, Object>> mlist = new ArrayList<>();

で構成して、AJAX通信で受信したJSプログラム側が、Chart.js グラフオブジェクトに展開する時に、
1本ずつ展開する。
時刻フォーマットは、TimeChartJsonBuilder で決められており、
時刻のデータ moment-with-locale.js で生成する。

      $.each(e.list, function(i, data){
         $.each(data.plist, function(n, v){
            graph.datasets[i].data.push(
               { t:moment(v.time, "YYYY-MM-DD HH:mm:ss.SSS"), y:v.value }
            );
         });
      });

サンプルグラフ描画
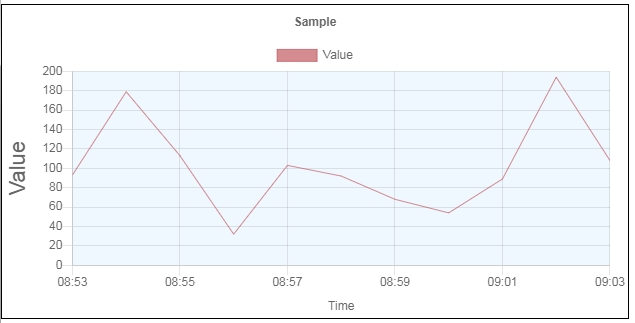
f:id:posturan:20190401095816j:plain

java.lang.reflect.Type インスタンスを生成する方法

総称型orクラスを知りたい時、知らせたい時に java.lang.reflect.Type を伝える為の
Type インスタンスを生成する方法
Google guice を使用している前提で2通りある。

com.google.common.reflect.TypeToken

import com.google.common.reflect.TypeToken;
TypeToken.of(Integer.class).getType();

TypeToken は、guice の依存先である Google guava Android の common にある。
guava/android at master · google/guava · GitHub

com.google.inject.TypeLiteral

import com.google.inject.TypeLiteral;
TypeLiteral.get(Integer.class).getType();

TypeLiteral は、guice 本体のJARの中に含まれる。

Wicket Bootstrap navbar と pagenation

Wicket で、Bootstrap を採用して navbar と Wicket の DataView で描画するページング
Bootstrap の Pagenation にするようにした時、
デザイン作業中は問題ないのですが、
z-index の指定をしないと、 navbar のドロップメニューが Pagenation の下に隠れてしまいます。
f:id:posturan:20190326200641j:plain

これは困ります。
f:id:posturan:20190326200743j:plain
期待するのは、以下です。
f:id:posturan:20190326200841j:plain
HTML

<div>
   <nav class="navbar navbar-expand-lg navbar-dark bg-info">
      <a class="navbar-brand" href="#">Navbar</a>
      <button class="navbar-toggler" type="button"
 data-toggle="collapse"   data-target="#sample_Navbar"
 aria-controls="sample_Navbar" aria-expanded="false"
 aria-label="Toggle navigation">
         <span class="navbar-toggler-icon"></span>
      </button>
      <div id="sample_Navbar" class="collapse navbar-collapse">
         <ul class="navbar-nav mr-auto">
            <li class="nav-item active">
               <a class="nav-link" href="#">Home<span class="sr-only">(current)</span></a>
            </li>
            <li class="nav-item"><a class="nav-link" href="#">Link</a></li>
            <li class="nav-item dropdown">
               <aclass="nav-link dropdown-toggle" href="#" id="navbarDropdown"
                role="button" data-toggle="dropdown" aria-haspopup="true"
               aria-expanded="false"> Dropdown </a>
               <div class="dropdown-menu" aria-labelledby="navbarDropdown">
                  <a class="dropdown-item" href="#">Action 1</a> <a
                     class="dropdown-item" href="#">Action 2</a> <a
                     class="dropdown-item" href="#">Action 3</a> <a
                     class="dropdown-item" href="#">Action 4</a> <a
                     class="dropdown-item" href="#">Another action</a>
                  <div class="dropdown-divider"></div>
                  <a class="dropdown-item" href="#">Something else here</a>
               </div></li>
            <li class="nav-item"><a class="nav-link disabled" href="#"
                tabindex="-1" aria-disabled="true">Disabled</a></li>
         </ul>
         <form class="form-inline my-2 my-lg-0">
            <input class="form-control mr-sm-2" type="search"
               placeholder="Search" aria-label="Search">
            <button class="btn btn-outline-dark btn-sm" type="submit">Search</button>
         </form>
      </div>
   </nav>
</div>
<div wicket:id="paging" id="paging">
   <nav>
      <ul class="pagination">
         <li class="page-item">
            <a class="page-link" href="#" aria-label="Previous" disabled="disabled">
             <span aria-hidden="true">&laquo;</span>
             <span class="sr-only">Previous</span>
            </a>
         </li>
         <li class="page-item"><a class="page-link" href="#" disabled="disabled">1</a></li>
         <li class="page-item"><a class="page-link" href="#">2</a></li>
         <li class="page-item"><a class="page-link" href="#">4</a></li>
         <li class="page-item"><a class="page-link" href="#">5</a></li>
         <li class="page-item"><a class="page-link" href="#">6</a></li>
         <li class="page-item"><a class="page-link" href="#">7</a></li>
         <li class="page-item"><a class="page-link" href="#">8</a></li>
         <li class="page-item"><a class="page-link" href="#">9</a></li>
         <li class="page-item"><a class="page-link" href="#">10</a></li>
         <li class="page-item">
            <a class="page-link" href="#" aria-label="Next">
            <span aria-hidden="true">&raquo;</span>
            <span class="sr-only">Next</span>
            </a>
        </li>
      </ul>
   </nav>
</div>

対処していないCSS

.navbar a.dropdown-toggle:focus, .navbar a.dropdown-toggle:hover{
   color: #ffffff;
   background-color: #128091;
   box-shadow: 0 0 0 0.2rem rgba(227, 144, 169, 0.25);
}
.dropdown-item:active{
   color: #ffffff;
   background-color: #17a2b8;
}
.dropdown-item:hover{
   color: #ffffff;
   background-color: #17a2b8;
}

(解決方法)
navbar に、z-index: 1000; を指定します。
デフォルト z-index; 1000; だと思いますが敢えて明示的に指定する。

.navbar{
   z-index: 1000;
}

Pagenation の方を、z-index で低く、
確実に指定するので、!important まで付けます。

.pagination{
    z-index: 1 !important;
}

あるいは、Wicket ID と id 属性まで指定して pagination より
上位層の id="paging" につけても
良いでしょう。

#paging{
    z-index: 1 !important;
}

MalformedException の捕捉処理を書き易くする。

Google gson fromJson JsonParser で発生する JSON書式エラー、MalformedException の捕捉を
するとして、try~ctach 文の中に書いてもいいのですが、
1つのロジックで何回もJSON読込みの必要な処理があって、毎回 catch文の中で
MalformedException の捕捉を書くのはナンセンスです。
そこで、ラムダで宣言してcatch文の Exception を読み込ませるというのを作りました。

JsonMalformed check = JsonMalformed.of((l, c, p)->{
    System.out.println("line   = " + l );
    System.out.println("column = " + c );
    System.out.println("path   = " + p );
}, u->{
    System.out.println("unknown :" + u.getMessage() + " "+u.getClass().getName());
});
try{
   JsonReader reader	 = new JsonReader(new StringReader(str));
   new JsonParser().parse(reader);
}catch(Exception e){
  if (check.confirm(e)){
      // TODO 書式エラー以外のエラー
  }
}

malformedcatch · yipuran/yipuran-gsonhelper Wiki · GitHub

GitHub - yipuran/yipuran-gsonhelper: Google gson use library

JSONの書式チェック

Google gsonfromJson JsonParser 生成は、次のようなJSONであると

{
   "A": "12",
}

com.google.gson.JsonSyntaxException:
com.google.gson.stream.MalformedJsonException:
Expected name at line 3 column 2 path $.A

と例外を発生してくれます。

JSONテキストを事前にチェックする機能を考えた時、すぐに思いつくのが、、

JsonReader reader = new JsonReader(new StringReader(jsonstr));
try{
   new JsonParser().parse(reader);
}catch(JsonSyntaxException e){
   String causemessage = Optional.ofNullable(e.getCause())
   .filter(t->t instanceof MalformedJsonException).map(t->t.getMessage())
      .orElse("Unknown Error");
}

↑は、JSON文字列 jsonstr が NULL でなければ、想定どおり JsonSyntaxException で catch して動くのですが、
JsonParser で parse 対象が NULLだったり、try の中の状況によっては、これはダメです。

 .filter(t->t instanceof MalformedJsonException).

でいきなり限定しているのも好ましくないです。
そこで、以下のような static メソッドを用意します。

public static boolean parseFormat(String str, Consumer<String> malform
                                 , BiConsumer<Throwable, String> unknowns){
   try{
      JsonReader reader    = new JsonReader(new StringReader(str));
      new JsonParser().parse(reader);
      return true;
   }catch(JsonSyntaxException e){
      Throwable cause = e.getCause();
      if (cause==null){
         unknowns.accept(e, e.getMessage());
      }else if(cause instanceof MalformedJsonException){
         malform.accept(cause.getMessage());
      }else{
         unknowns.accept(cause, cause.getMessage());
      }
   }catch(Exception e){
      unknowns.accept(e, e.getMessage());
   }
   return false;
}

こうすれば、、

if (parseFormat(jsonstr, m->{
   // m = MalformException の getMessafe()
   // TODO 書式エラーの処理
}, (t, m)->{
   // t = MalformExceptionでない他の Throwable
   // m = t の getMessage()
   // TODO 読込エラーの処理
})){
   // JSON 文字列 jsonstr が書式で問題なく Gson fromJson を実行できる
}

と整理できます。
この static メソッドを使い回せるようにしたいと思います。